Make better business decisions that improve your organization and drive revenue faster with Labsols BI.
Enormous volumes of data flow through Laboratory Information Management Systems (LIMS) each day. Orders are received, samples are tracked, results are entered and verified and reports are sent back to the customers. How do laboratories harness the information generated for value-added delivery? Lab databases can be considered a repository of established knowledge and a source for new knowledge from which to build a framework for business intelligence and decision making.
Traditionally, if a laboratory manager wanted to create a specific new productivity report, they had to ask their IT department to pull together the data and create the desired report. In recent years, laboratory informatics companies are crafting products specifically designed to deliver Business Intelligence to their customers and clients. Business Intelligence (BI) is a set of computer-based tools that provide organized, well structured and understandable views of laboratory operational and financial data.
Labsols BI can greatly assist management to better understand their laboratory operations and make well founded, prudent decisions to meet laboratory objectives. Best of all, real-time dashboard reports can often be delivered directly to the manager’s desktop, iPad, or mobile device, helping her/him to make better decisions and improve processes.
Labsols goes beyond the traditional with integrated BI (Business Intelligence) features, empowering your laboratory to create intricate data graphs. These visually rich representations can be seamlessly shared across various business departments, offering invaluable support for strategic decision-making and real-time monitoring of analytical activities. Leveraging cutting-edge technologies, Labsols BI ensures interactive, updated dashboards, upholding the utmost data confidentiality for your lab's operations.
Interactive visualizations are a powerful approach for data exploration. Labsols LBI provides standard and custom visualizations with modern technology visualization tools. A suite of defined dashboards allows the laboratory operations people at different departments to effectively explore the data to uncover key insights.
For optimal laboratory operations, it's crucial for management to understand the breakdown of operational costs and the structure of income. Harness the power of Labsols Lab Business Intelligence solution to gain valuable insights into laboratory operation statistics and trends from various perspectives. Dynamic calculations of turnaround times, identification of bottlenecks, and tracking key performance indicators (KPIs) empower you to share analytics with management online. The result is a more effective and competitive laboratory environment.
Labsols Lab BI unveils the unseen, exposing concealed insights and rectifying non-plausible results within extensive research data. A guardian against biases in information handling, it presents a visual, interactive, and associative approach, transforming the analysis of massive information into an enlightening experience.
When a new LIMS is taken into use, a need often emerges to create trends and statistics from the previously collected data that still remains in the old system. Or, sometimes data needs to be combined from multiple systems. Labsols Lab BI provides solutions for utilizing scattered data in multiple system, whether old or new, so that data can be analyzed most efficiently.
Break free from IT-driven constraints. With Labsols Lab BI, empower laboratory users with seamless ad-hoc data search, dynamic time scale adjustments, and versatile data perspectives – all at their fingertips. Say goodbye to total reliance on IT personnel and let end-users harness the power of data for maximum benefit.
Labsols's laboratory operations specialists combine global experience and in-depth knowladge with LBI's data analytics to turn everyday laboratory information into actionable insights that match up with business strategies and operational goals.
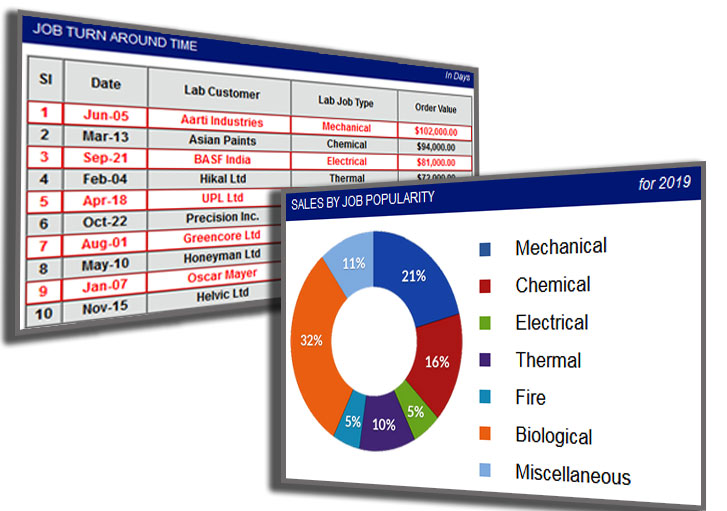
Labsols LBI help laboratory to evaluate its performance using KPIs from data generated in LIMS. Each laboratory can configure KPIs allowing effective use of the analytical data to support strategic decision making. It allows the generation of complex graphs for the representation of data that can then be shared with other business processes.
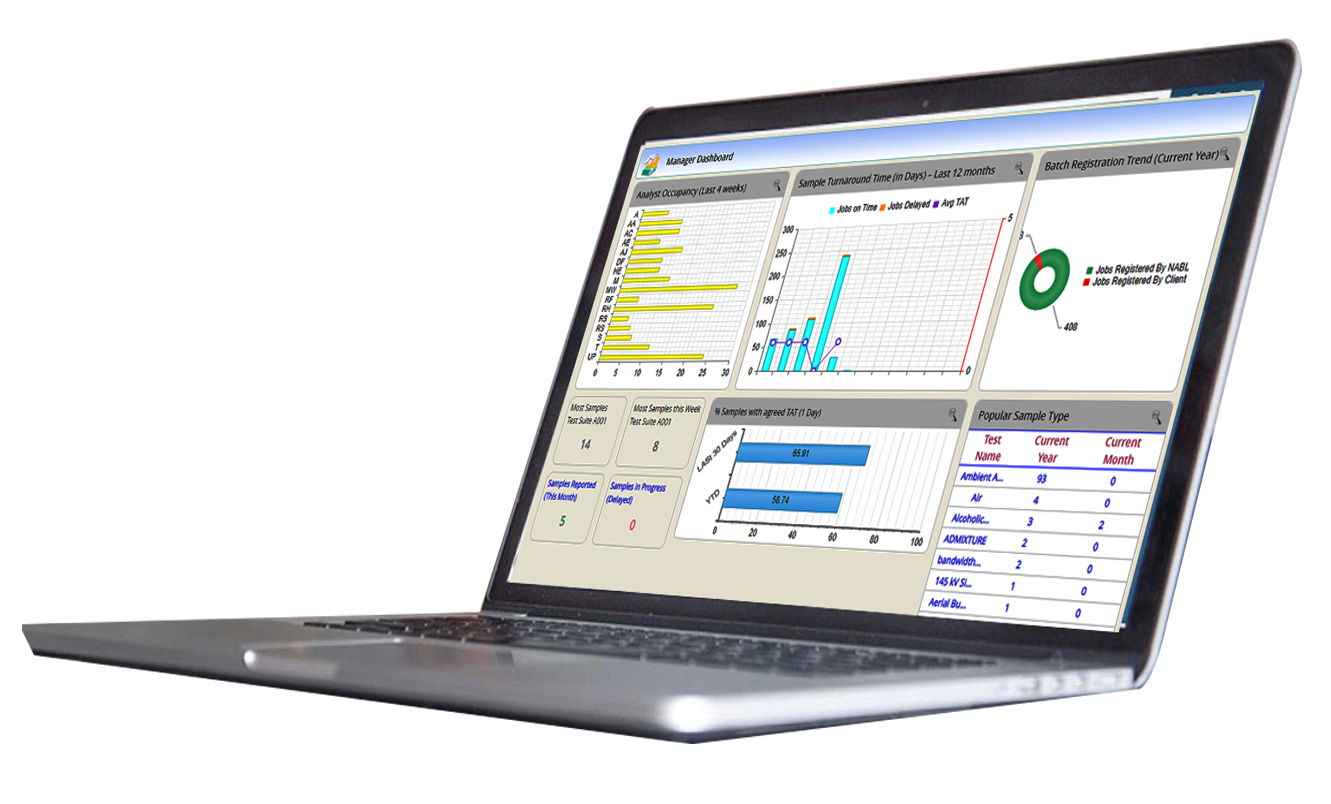
The Manager Dashboard is a quick overview of all current orders. It also shows detailed comparison with historical data. This particular dashboard help to under order numbers of a particular year, month, week, day and even hour and minutes.
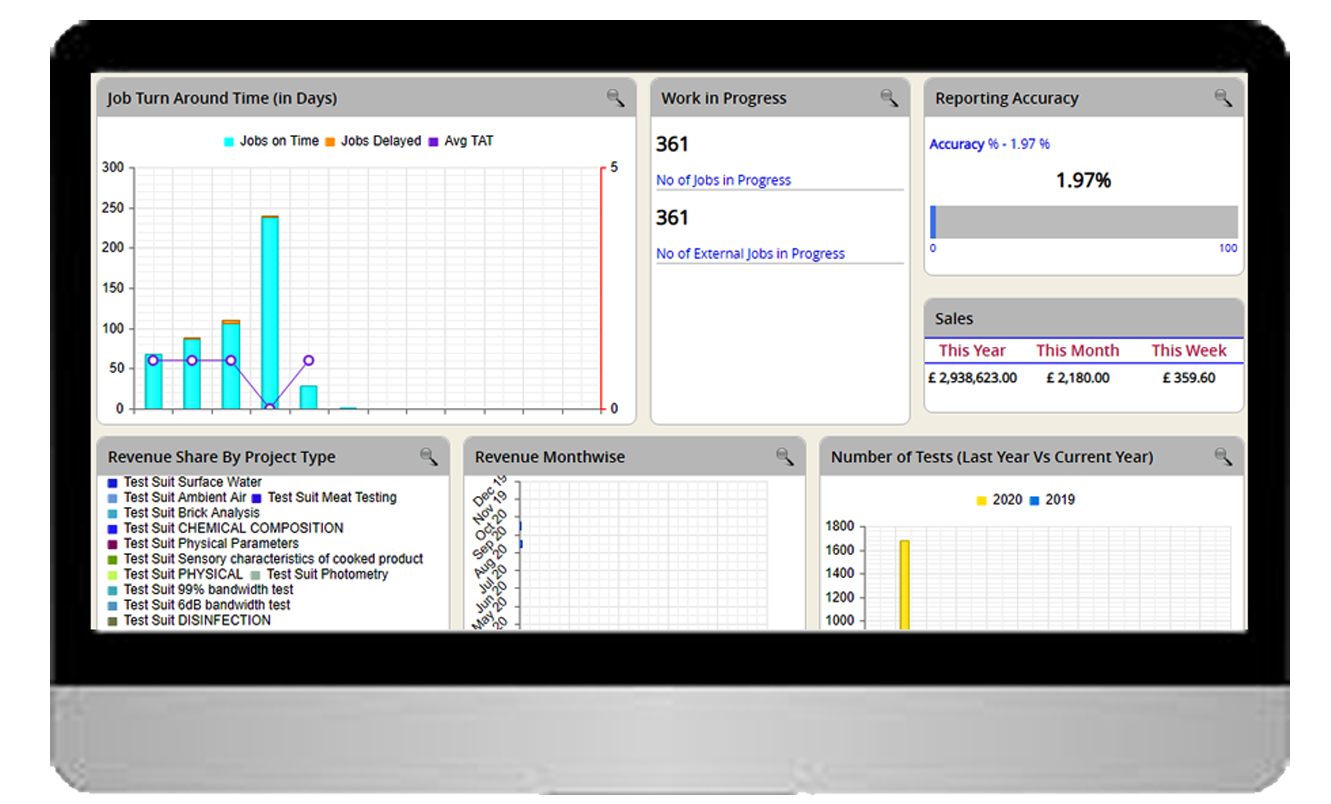
The Executive Dashboard help you track the above elements in real-time. You will measure how you’re doing in terms of processes, inventory, and environment. It is a very important part of the digital strategy.
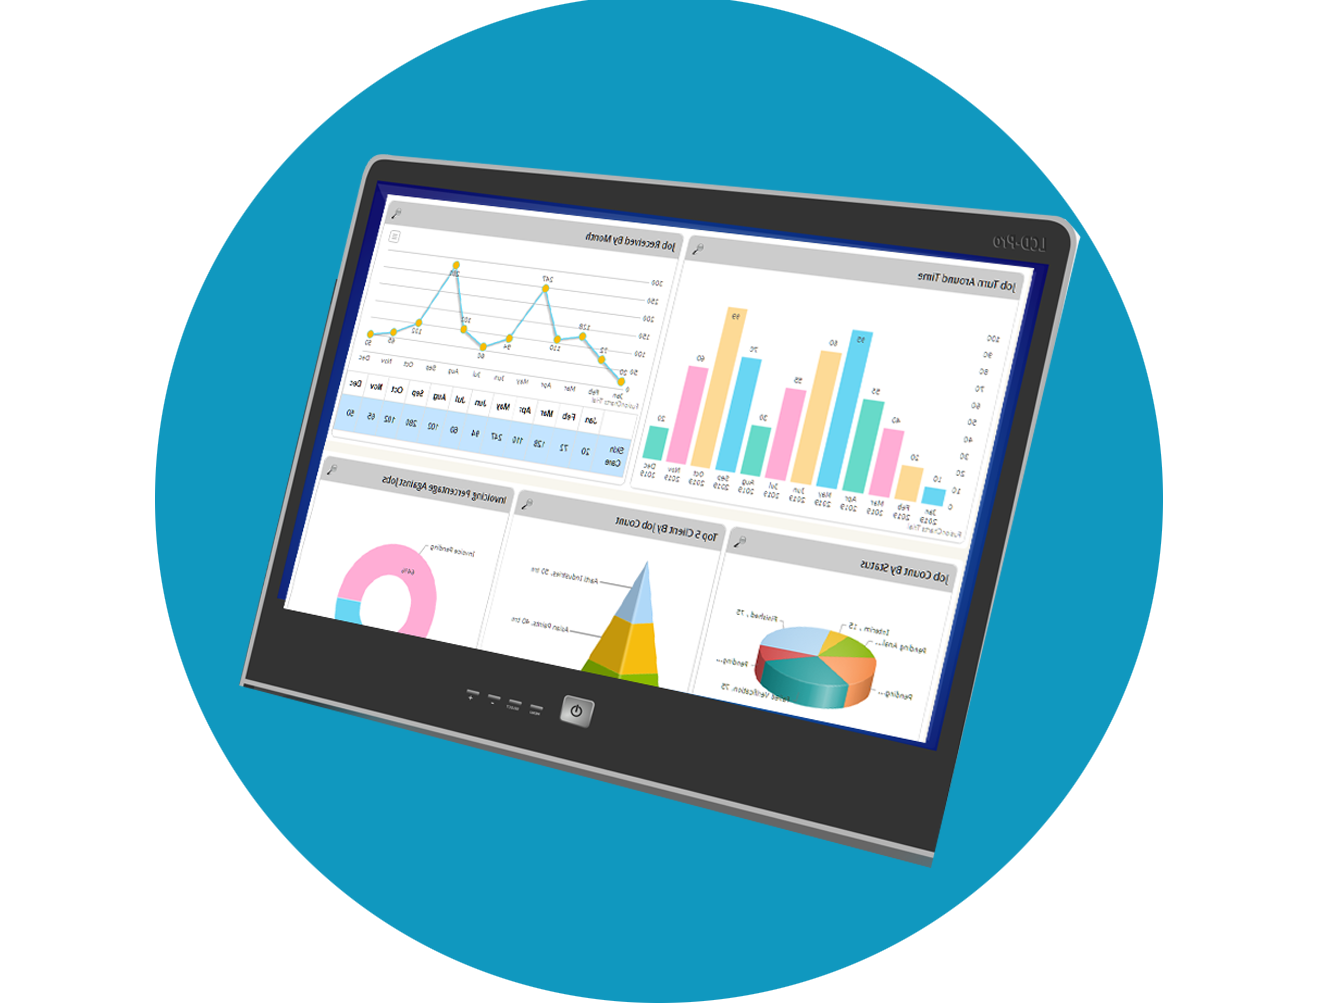
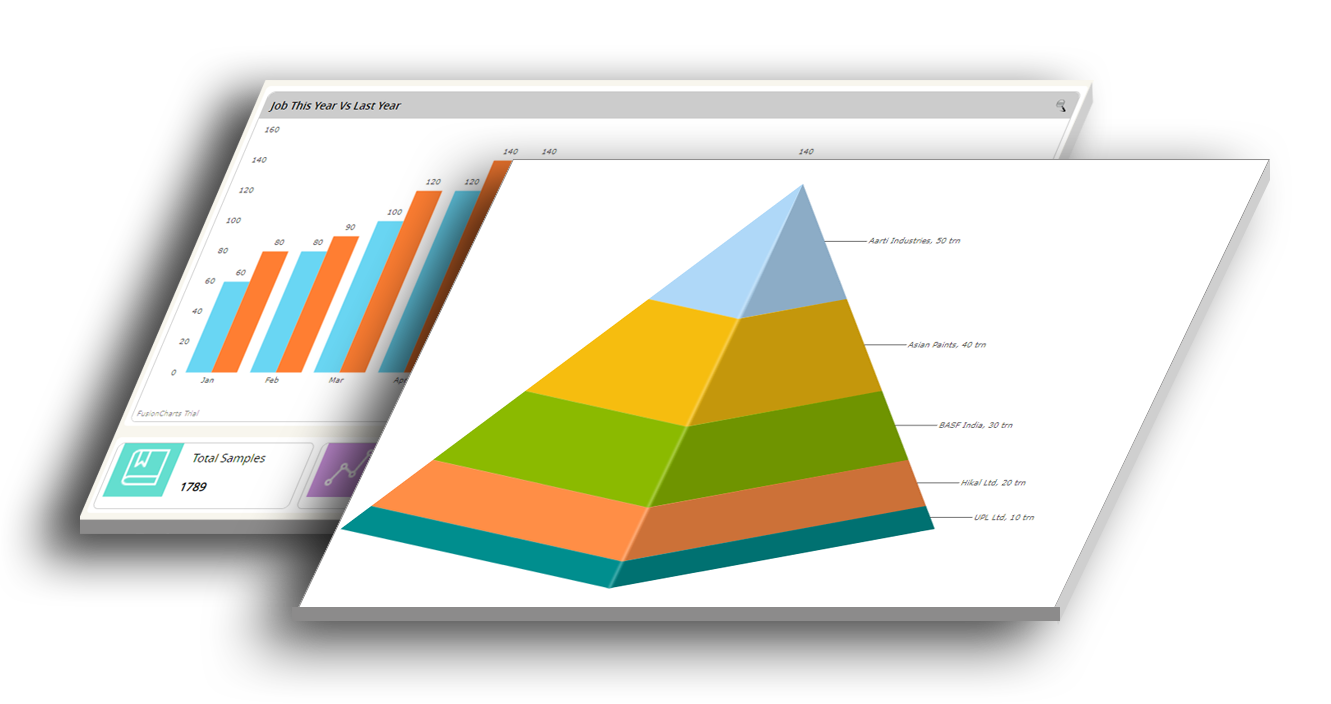
Having Job Dashboard in place opens a whole new opportunity to optimize the performance of your lab. When allocating tasks or jobs to lab managers in single or multiple sites of your lab you first need to determine what is important for the performance of the department. By having this KPI in check you will ensure that you produce data of high quality and that you keep your jobs under control. You will be able to identify the bottlenecks and poor performing parts of your lab to act upon it.

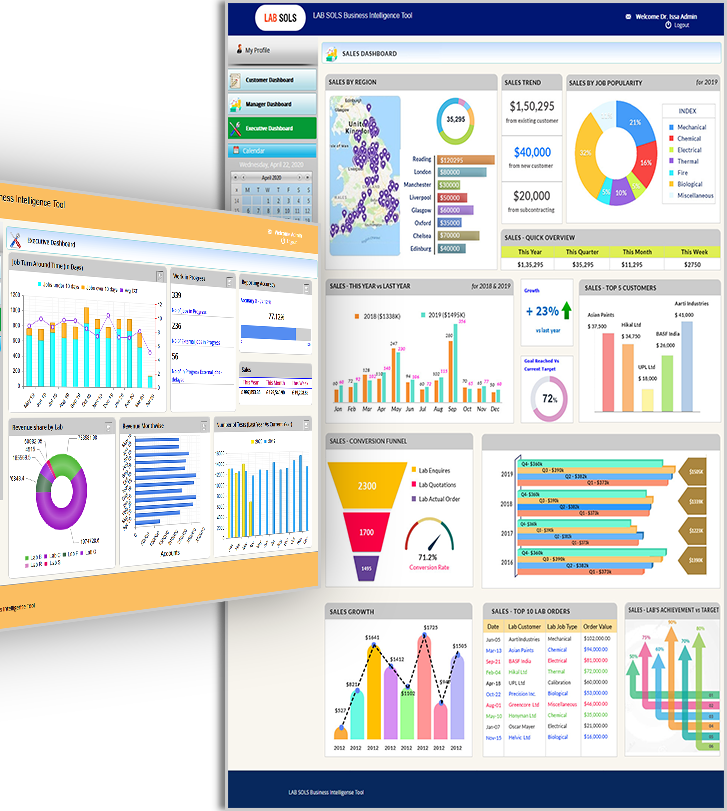
In this overview, Labsols Sales KPI enables you to manage your sales more effectively and optimize as well as analyze laboratory sales process in detail. In order to make a complete picture of your sales development and data, we have created a powerful sales dashboard that will centralize your KPIs in an interactive form and enable you to dig even deeper. That way, you will be able to control your sales activities, identify potential bottlenecks, and optimize your sales BI processes more effectively.

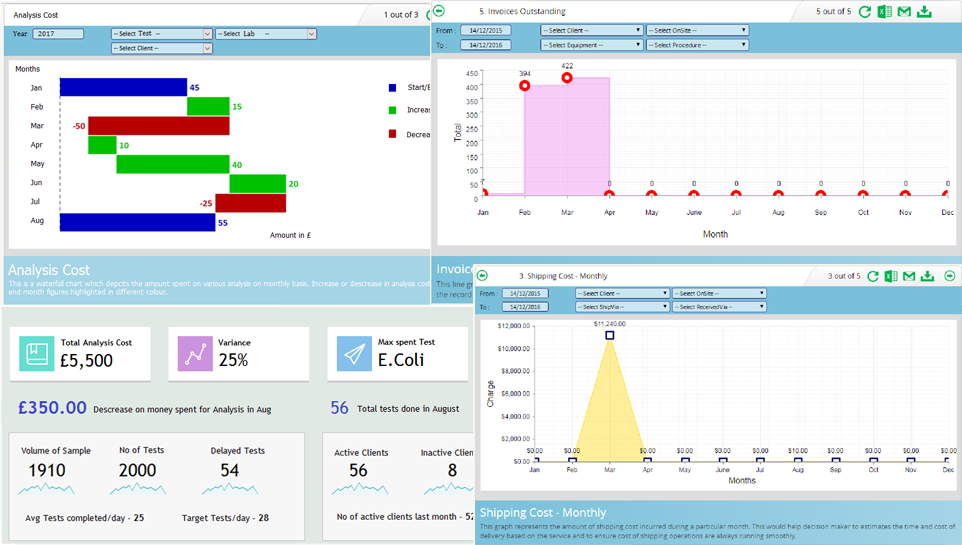
Lab Financial Dashboard is a measurable value that indicates how well a laboratory business is doing regarding generating revenue and profits. Monitoring KPIs shows whether a business is achieving its long-term goals. With our financial business intelligence, you have the opportunity to make your financial data and insights better, more informative, and easier to manage.
Although it can be easily forgotten about, it remains one of the single most effective ways to reduce costs and improve productivity.
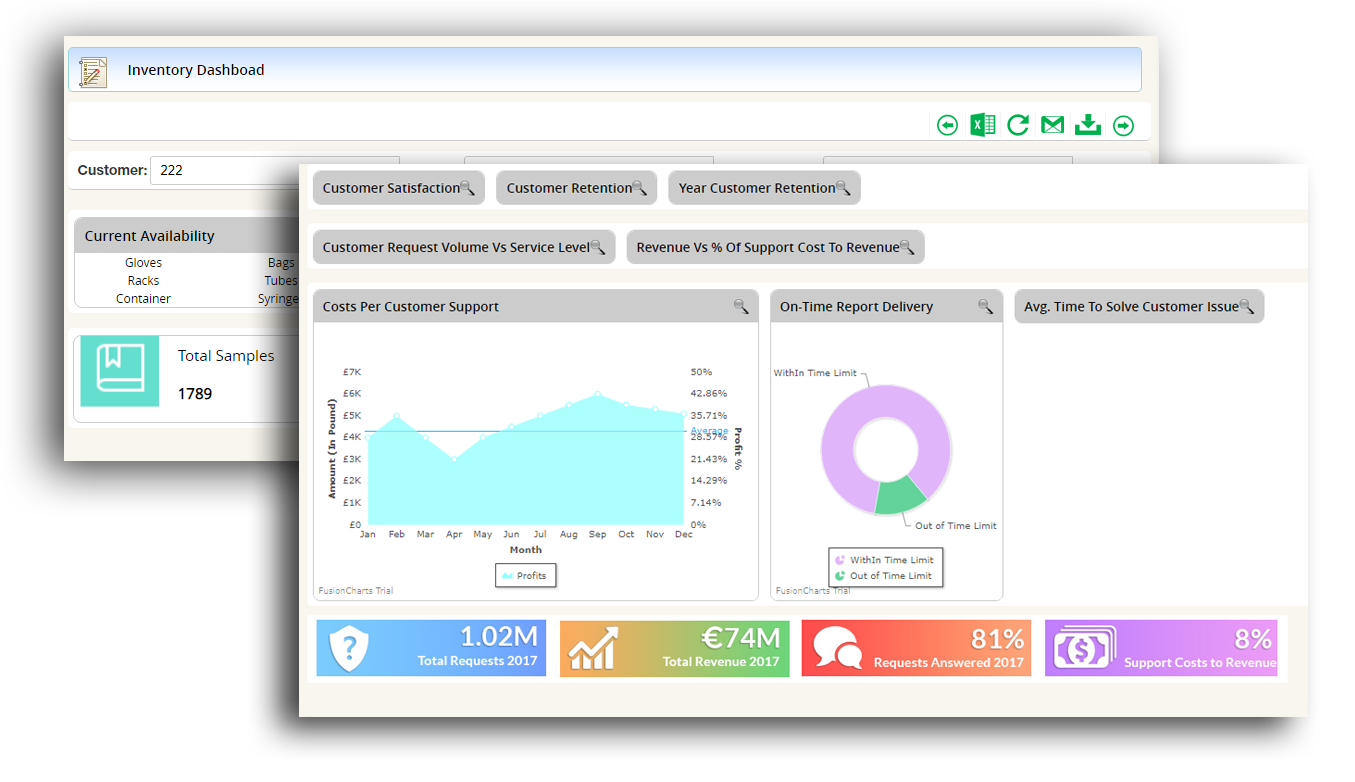
No matter the size of your lab, controlling inventory is one of the most important things you can do to make everything run smoothly. Monitoring consumable supplies, reagents, lab equipment, and instruments can be a big task. But doing so efficiently will increase productivity and reduce costs. To help, the Labsols teams have put together this handy KPI to lab inventory management.

Over the past few years, nearly every laboratory manager has been faced with the seemingly contradictory demands from management to shrink budgets and from clients to increase services. Is it possible for a lab manager to resolve this contradiction to meet both performance expectations? The solution may be the same one that has driven economic expansion for years–increase productivity.
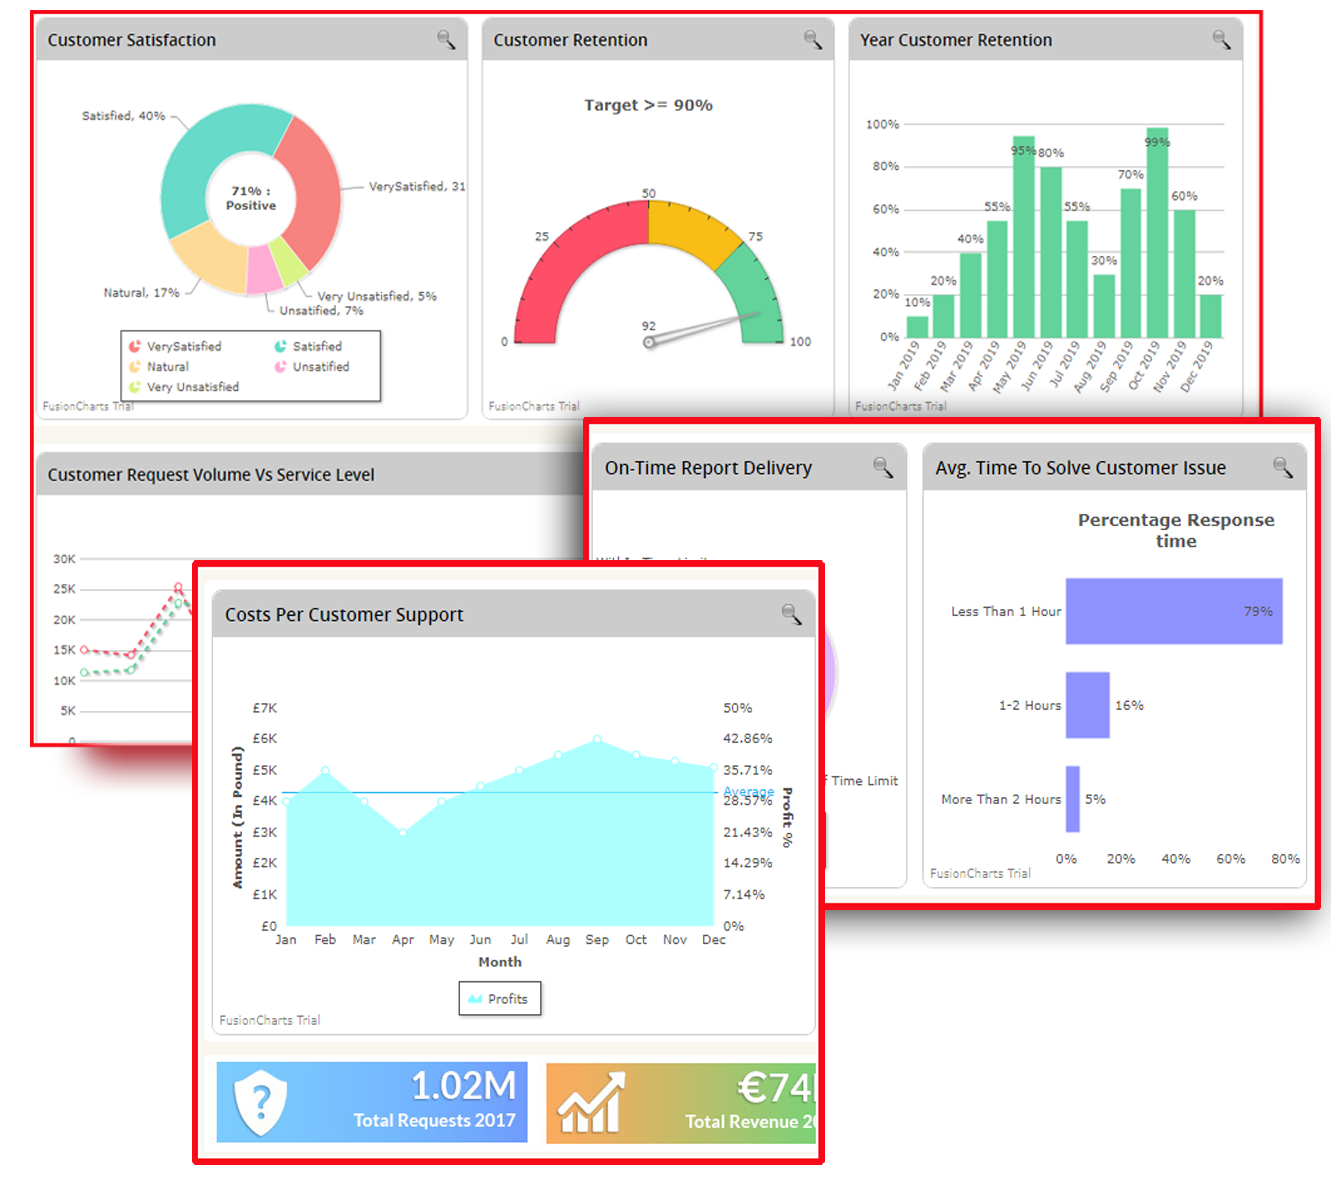
If you're not measuring your lab customer service, how will you judge the success of your actions? If you're serious about improving customer service, you need to track your CS KPI.
Labsols customer service KPI is a performance measurement that is used by lab customer service teams and by the lab customer support management to monitor, visualize, analyze and optimize customer relations by taking advantage of an advanced 360-degree customer view.
This dashboard make sure laboratory professionals, and administrators work together to ensure that laboratory tests and results provide real lab benefit to customers while en suring that laboratory testing is both cost-effective and appropriately used. In short, it’s confirming the right test, at the right time, for the right customer, and at the right cost.
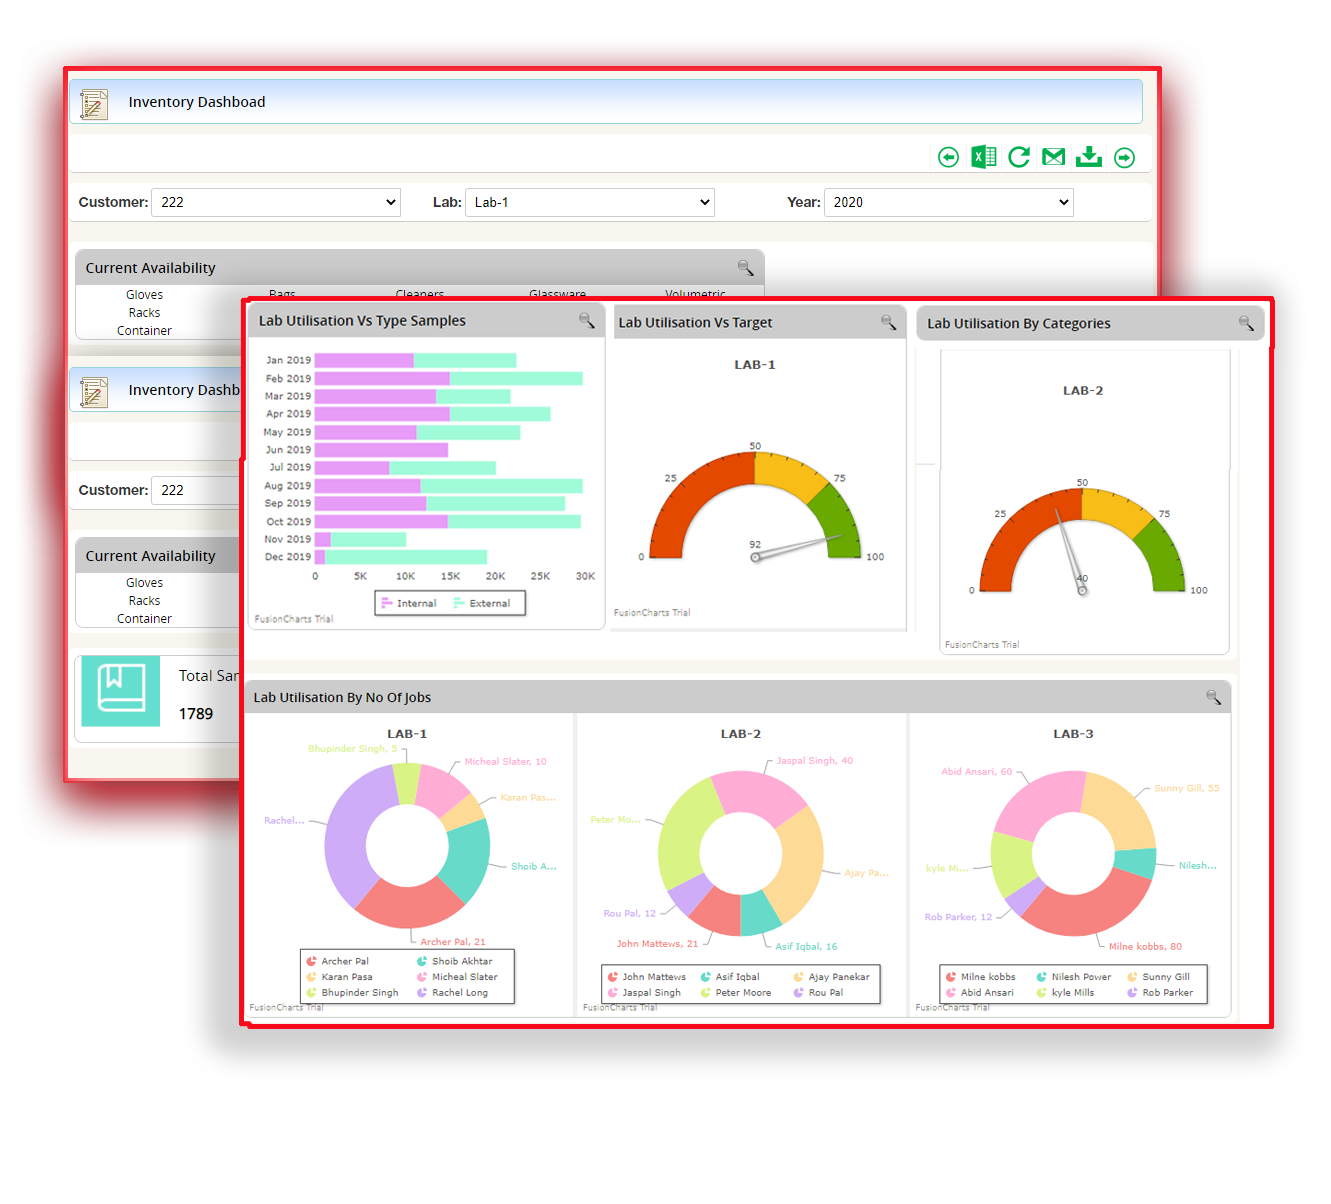
The goal of Utilization Dashboard is to maintain or improve the quality of care without increasing the cost of laboratory testing.
Labsols Business Intelligence solution allows you to view and analyze all the lab data stored in your LIMS solution so you can make critical business decisions. Quickly answer questions for root cause analysis, identify bottlenecks causing performance issues and opportunities for improvement, and help build a business case for new resources. Colorful visualizations help lab managers proactively act on facts, apply remediation plans, and see the results of their actions, resulting in a more efficient organization.
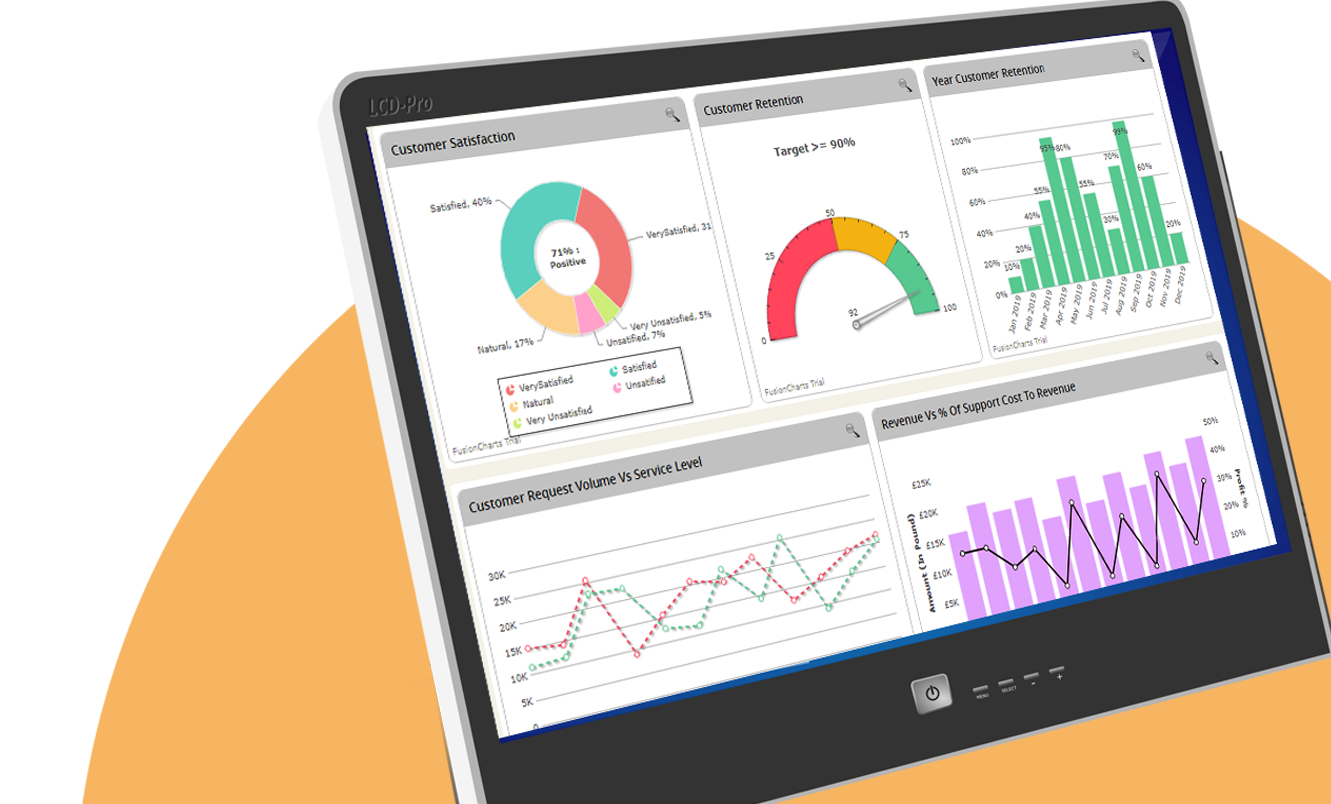
The dashboards used to drive many of the processes within Labsols contain appropriate graphical and tabular representations of the process being performed. The Key Performance Indicator dashboard contains measures to aid with the efficient operation of the laboratory.
Displayed in the form of simple to interpret graphs, charts and diagrams, these tools allow key LIMS information to be represented in way that facilitates the decision-making process.


Labsols is a laboratory software solutions vendor with offices in the UK and India, and distributors worldwide. Labsols has developed, customized, implemented and supported solutions for various industries for last two decades. Boost your lab's performance with Labsols' lab automation solutions, enhancing productivity, efficiency, data integrity, and compliance.

 (+44) 118 328 2490
 (+91) 9123329271